StatsGenerator
Group (Subgroup)
Synthetic Building (Generation)
Description
This Filter creates the arrays necessary to generate synthetic microstructures.
The StatsGenerator Filter was created to allow users to quickly generate a set of statistics that can be used to create a synthetic microstructure. Using this Filter, the user can generate the necessary statistics that describe a microstructure, with the aid of visual plots of the statistics, and immediately use them in the Pipeline to generate a synthetic microstructure. The statistics data can also be saved to a DREAM.3D file for later use.
The set(s) of statistics that can be generated in this program correspond to the set(s) used by "Feature packing algorithms" in DREAM.3D. DREAM.3D chooses to classify Features in Phase Types, which define the set of statistics used to describe the key metrics for those Features. The Phase Types that can currently be selected in DREAM.3D are Primary, Precipitate and Matrix. The statistics that describe each of these Phase Types are listed below:
| Primary | Precipitate | Matrix |
|---|---|---|
| {Volume fraction} | {Volume fraction} | {Volume fraction} |
| {crystal structures} | {crystal structures} | {crystal structure} |
| {fraction on Feature boundary} | ||
| size | size | |
| shape (aspect ratios) | shape (aspect ratios) | |
| Omega3 | Omega3 | |
| radial distribtion function (RDF) | ||
| number of neighbors | ||
| ODF (crystallographic orientation) | ODF (crystallographic orientation) | |
| MDF | MDF | |
| axis ODF (morphological orientation) | axis ODF (morphological orientation) |
Stats designated with a { } are located on the Phase Properties Manager
Phase Properties
The user can use the following buttons to add, remove or edit a phase:
- Add

- Delete

- Edit

The user can add, remove or modify properties of the phase by clicking the Phase Properties Buttons at the bottom of the StatsGenerator GUI. The plus button allows the user to add a phase, the minus button allows the user to remove a phase, and the cogwheel button allows the user to edit the currently selected phase.
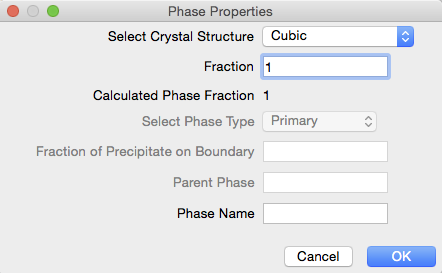
The Phase Properties is a dialog where the user can enter information about the phase for which statistics are currently being generated. The following items can be set in the manager:
- Select Crystal Structure: Allows the user to specify the crystal structure of the phase
- Fraction: The volume fraction of the phase. The Calculated Phase Fraction is updated as more phases are added, by scaling the current total of all the phases fractions to 1 (in case the user's total is not equal to 1 when finished)
- Select Phase Type: Specifies the type of the phase. Currently, the three supported types of phases are Primary, Precipitate and Matrix. Note that the first phase is defaulted to Primary and cannot be changed. If the user does not wish to have a Primary phase, then a second phase can be added and the initial Primary phase can then be removed.
- Fraction of Precipitate on Boundary: If the phase type is set to Precipitate, then the user must specify the number fraction (0.0 - 1.0) of the precipitates that are located on grain boundaries of the Primary phase. This value will be scaled to 1 if the user's value is larger than 1. The value is keyed to -1 for Primary phases
- Phase Name Set a name for the phase. Can be any string name the user wants.
Size Distribution Tab
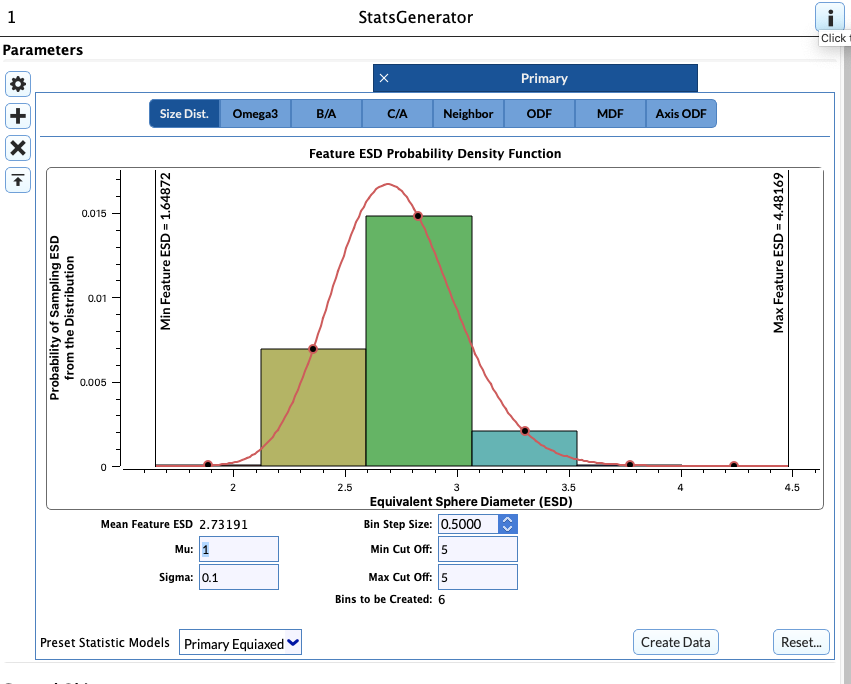
The plot displayed on this tab is the actual size distribution of the Features that will be placed for this phase. The X-axis is the equivalent sphere diameter (ESD) of the Feature. ESD indicates the diameter of a sphere that has the equivalent volume of the Feature. The units of ESD in this plot are in arbitrary units of length (i.e., meters, millimeters, microns, nanometers, etc). The Y-axis of the plot is the probability of sampling that ESD from the distribution. The parameters listed below are what define the size distribution and how it is binned for correlation with other statistical descriptors to be described later. When entering the parameters that define the size distribution, it is generally a good work flow to iteratively adjust the parameters while watching the plot until the plot appears "satisfactory" with respect to the location of the peak and the length of the "tails", rather that be overly concerned with the parameter values themselves.
These parameters define the size distribution itself but given a constant Bin Step Size will alter the number of bins that are created:
- Mu: The average value of the lognormal grain size distribution. Note that this is the average value of log(ESD). This value is in the same arbitrary units of length as the plot, but is not the average Feature size
- Sigma: The standard deviation of the lognormal grain size distribution. Note that this is not the standard deviation of the actual Feature size distribution, but of the log(ESD) values. This value controls the length of the "tails" of the distribution
- Sigma Cut Off Value: Allows the user to truncate the distribution to remove very large (or small) Features. These values show up as blue vertical lines on the plot and only the portion of the Feature size distribution between the two blue vertical lines can be sampled.

- Feature ESD: If the user would rather simply input the ESD directly instead of manipulating the Mu parameter then this field can be used as an alternate. After entering an ESD the user should type the RETURN or ENTER key or click somewhere else in the user interface to update the plots. This field and the Mu fields are linked. Changing one will update the other.
These parameters control the binning of the Feature size distribution:
- Bin Step Size: The size of bin to use in segregating the Feature size distribution into classes for correlating other statistics to Feature size. The point of creating size classes in the Feature size distribution is that it allows the user to give different shape or number of neighbors distributions to features at different points along the Feature size distribution. For example, the user can set to small Features to be spherical while making large Features elongated by modifying the statistics associated with Features in the lower bins differently than those in the higher bins. If the user has no desire to have different statistics for different sizes, then a large value can be used to create a single size class. Note that the Bins to be Created value is displayed in the bottom left corner, which tells the user for the given Bin Step Size how many size classes will be created along the Feature size distribution

These options set the initial defaults for the correlated statistics
- Preset Statistic Models: Allows the user to select a morphological type of microstructure to populate the default data. The two options currently provided are:
- Equiaxed: Populates the statistics tabs with data that is designed to generate a random equiaxed microstructure
- Rolled: Populates the statistic tabs with data that is designed to generate a rolled microstructure with elongated grains with user defined aspect ratios. If this preset is selected, the user is prompted to enter:
- A Axis Length: this is the length of the longest axis of the Feature(s)
- B Axis Length: this is the length of the intermediate axis of the Feature(s)
- C Axis Length: this is the length of the shortest axis of the Feature(s)
The values entered for these axis lengths DO NOT need to be actual lengths, but rather are used to establish aspect ratios, so they need only be relative
After all desired input fields have been set to desired values the user will need to click the Create Data button.
- Create Data: Locks in the values the user has entered and populates the other tabs with default values. The user can move through the other tabs and change any default values if desired.
IMPORTANT NOTE
Anytime the user changes any input fields in the Size Distribution tab the Create Data button MUST be clicked 
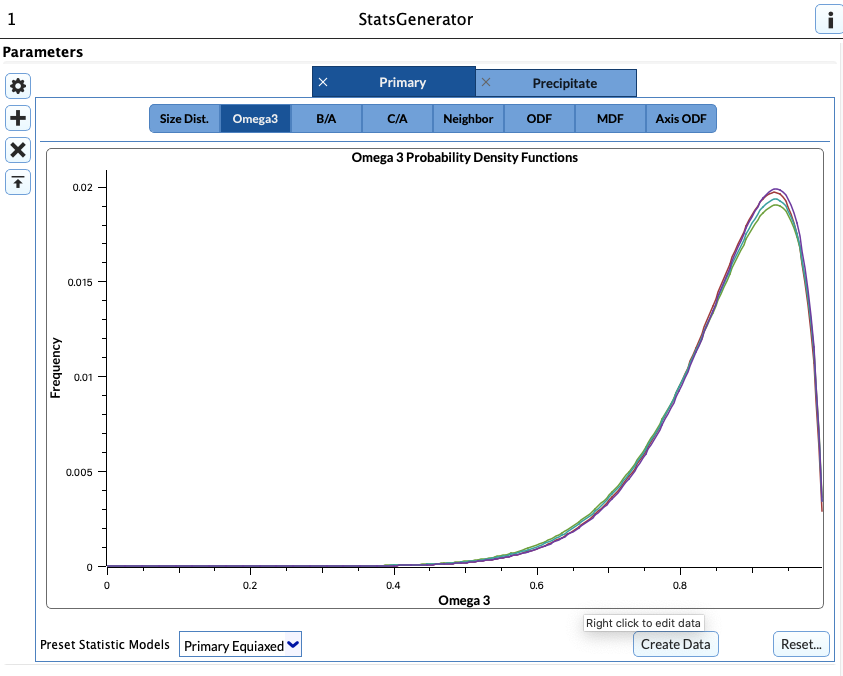
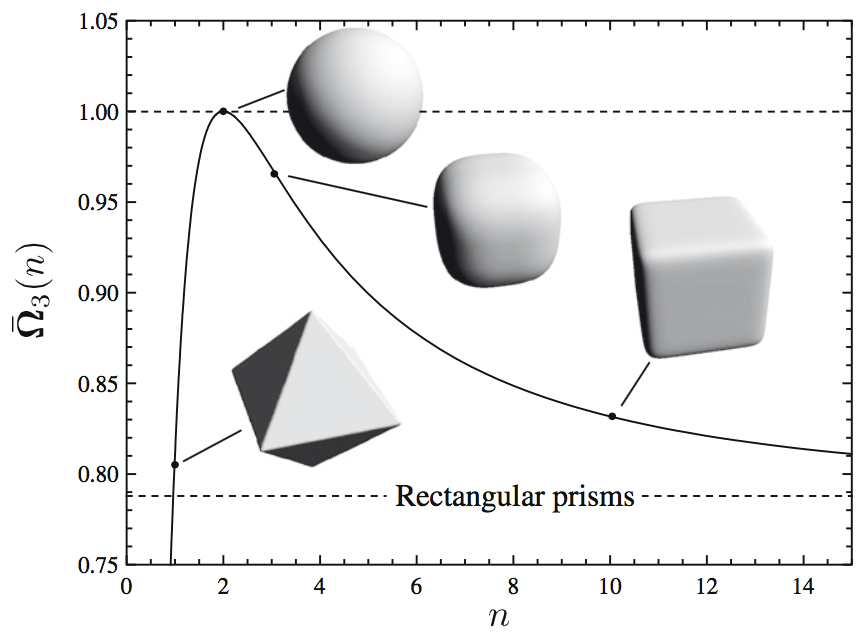
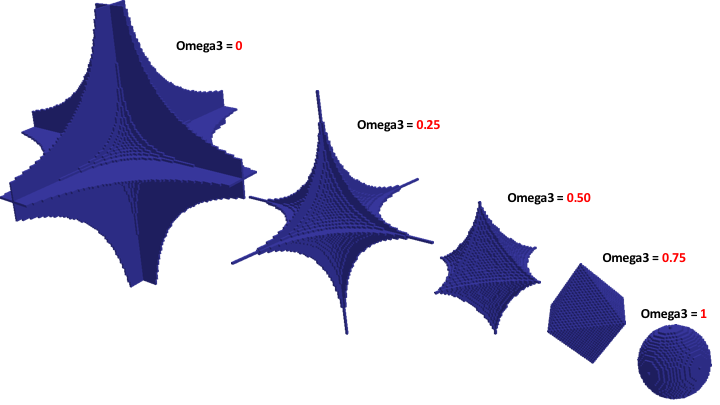
Omega3 Tab
The Omega3 tab controls the morphological shape of the features that are generated. Right-Click on the plot area to edit the values.
- Bin: Calculated from the size distribution and cannot be changed
- Alpha: The α parameter of a beta distribution. Omega3 is normalized and can only be between 0 and 1 to insure that the beta distribution is a good fit
- Beta: The β parameter of the beta distribution
Shape Distribution Tab
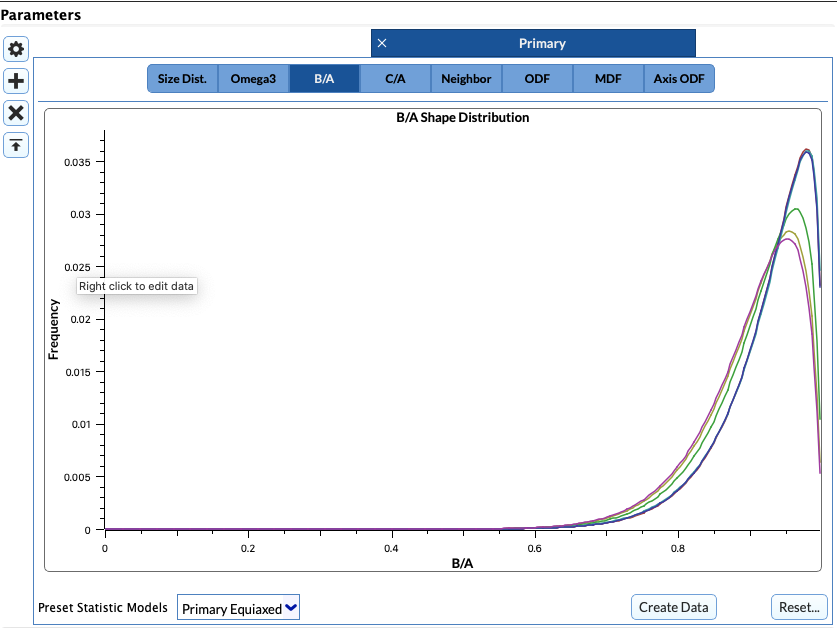
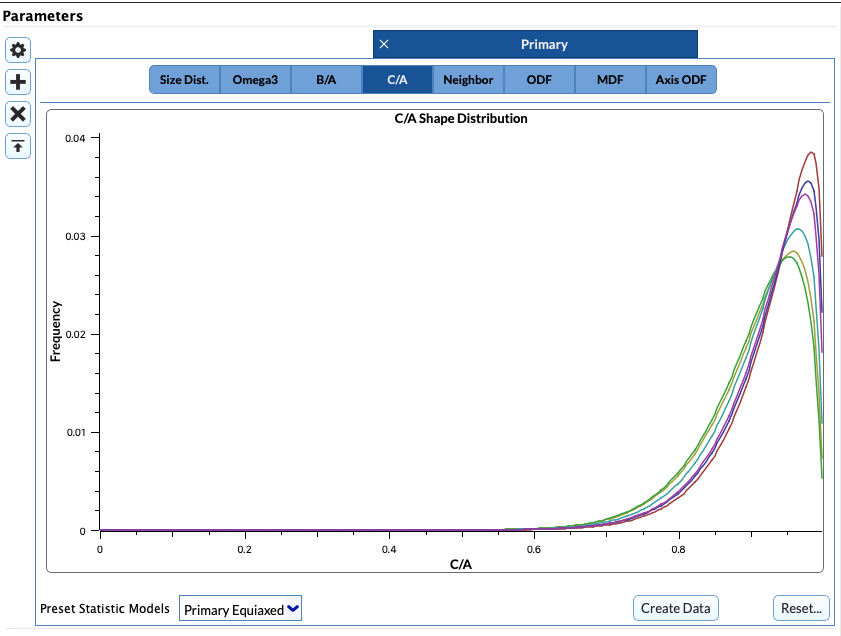
- Bin: Xalculated from the size distribution and cannot be changed
- Alpha: The α parameter of a beta distribution. B/A, C/A and C/B are normalized and can only be between 0 and 1 to insure that the beta distribution is a good fit
- Beta: The β parameter of the beta distribution
Neighbor Distribution Tab
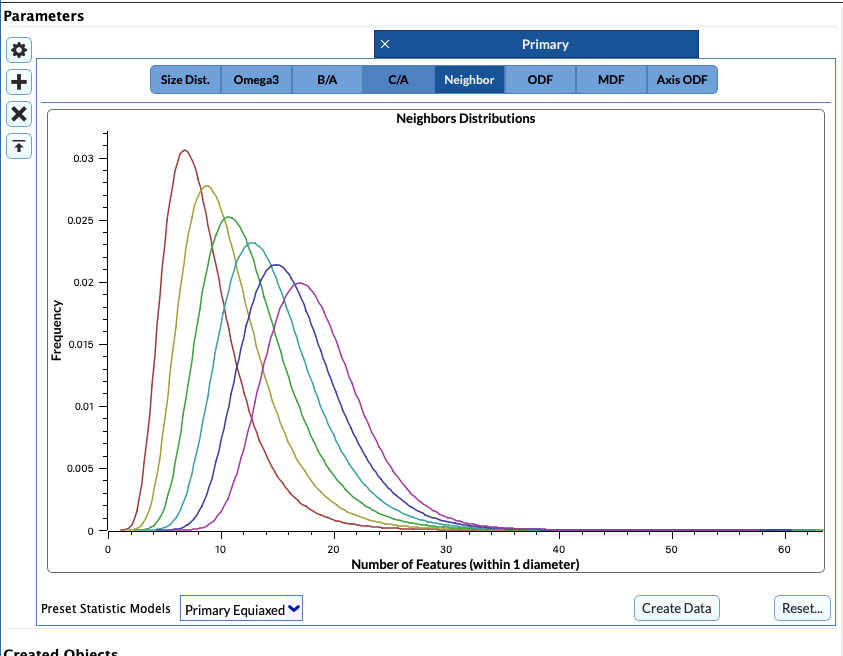
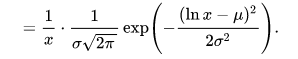
The Neighbor Distribution data is generated from a Log-Normal Probability Distribution Function(PDF) distribution.
- Bin: Calculated from the size distribution and cannot be changed
- Average: The x parameter of a Log-Normal Probability Distributeion Function (PDF).
- Standard Deviation: The σ parameter of a Log-Normal Probability Distributeion Function (PDF).
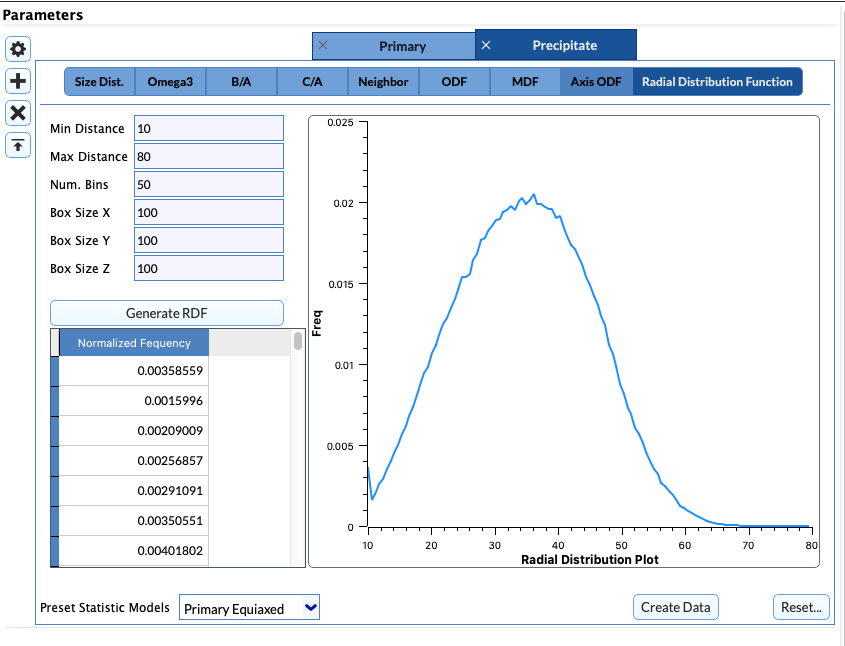
Radial Distribution Function Tab
This option is only available for the precipitate phase. ![Radial Distribution Function GUI] (Images/image010.png)
- Min Distance: The minimum separation distance between precipitates in the box
- Max Distance The maximum separation distance between precipitates in the box
- Num Bins The number of bins to create the RDF
- Box Size X The size of the x-dimension of the box in microns.
- Box Size Y The size of the y-dimension of the box in microns.
- Box Size Z The size of the z-dimension of the box in microns.
The list, Normalized Frequencies creates a random distribution based on the input parameters. If the user wants something else, the user may enter the values manually in the bins.
Also note, the number of created bins in the normalized frequency list may be MORE than the number of bins the user specified. This is because there are extra bins created for values that may fall outside the min and max distances the user sets. These extra bins will not be used, they are just there to help visualize the full distribution.
The user MUST click Generate RDF button for the values to get stored.
ODF Tab
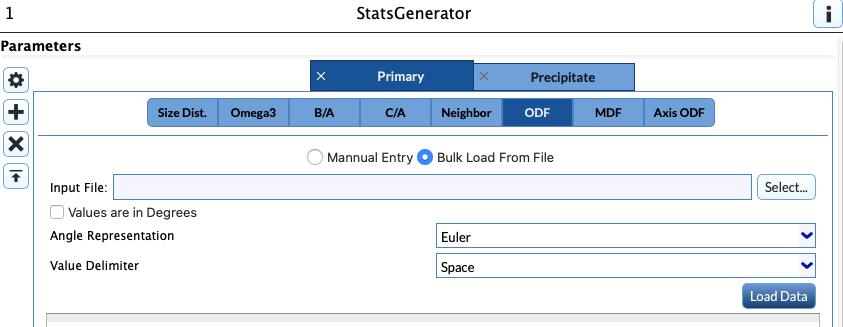
The ODF tab controls the generation of the Orientation Distribution Function. This is the place where the user can apply a crystalographic texture to their synthetic structure. The user can enter specific angles in degrees to add a texture to their synthetic structure or read angle representations from a simple text file. The format of the text file is described in the Write StatsGenerator ODF Angle File filter.
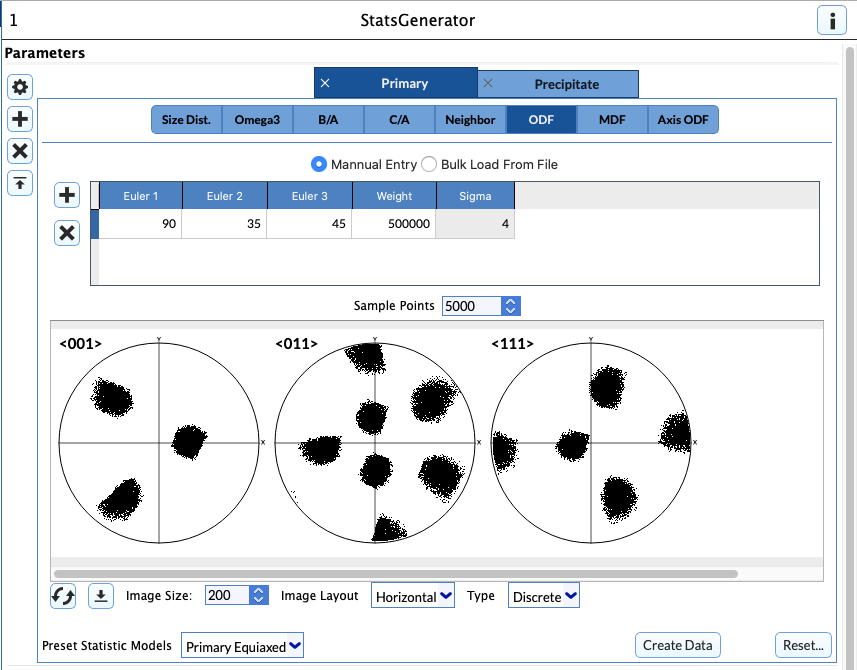
Weights and Spreads Section (ODF)
- Euler 1-3: The Euler angles that define an orientation that the user would like to increase in weight
- Weight: The weight in units of MRD (multiples of random distribution) for the entered orientation. To generate a strong texture use a value of 500,000.
- Sigma: Spread to use in blurring out the orientation chosen. The value corresponds to the number of bins in Rodrigues (orientation) space that it takes for the MRD value entered in the Weight column to reduce to 0.0 (decreasing quadratically from the bin of the entered orientation)
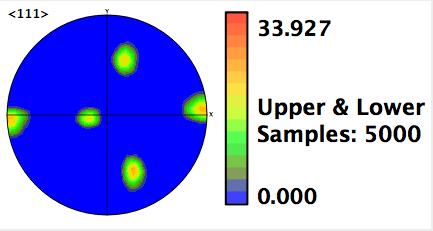
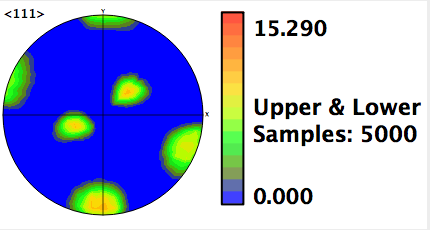
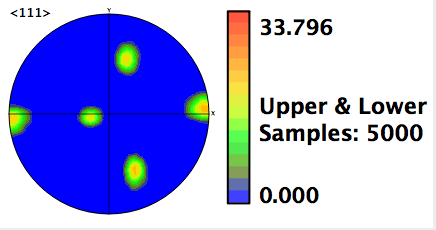
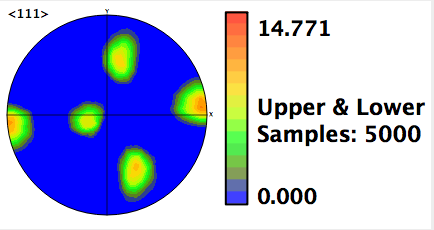
- Calculate ODF: Builds the ODF and then creates pole figures (PFs) for the user to inspect
- Three PFs are formed for each of the crystal structures that can be chosen (though they are of different directions for the different crystal structures)
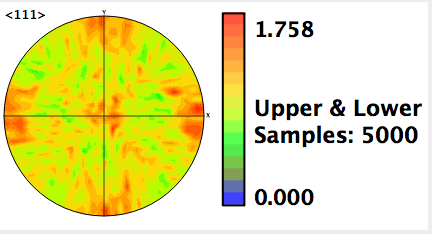
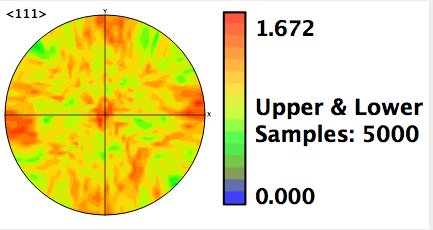
| Sigma = 1 | Sigma = 3 | Sigma = 5 | |
|---|---|---|---|
| Weight = 1 | 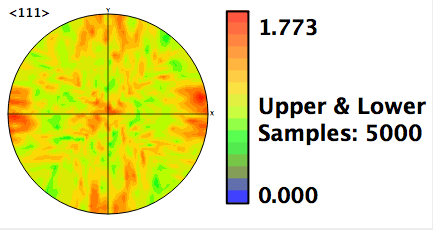 |
 |
 |
| Weight = 500 | 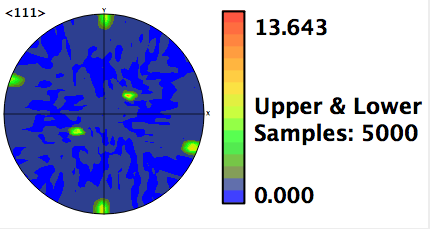 |
 |
 |
| Weight = 100,000 | 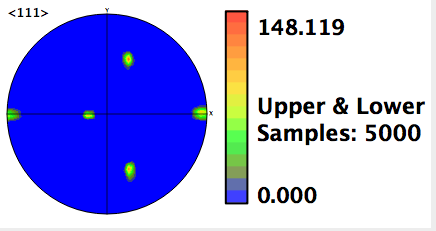 |
 |
 |
Bulk Load of Angle Data
The filter Export StatsGenerator ODF Angle File can help the user create the proper kind of file that is needed for this section to work. An example input file is below:
# All lines starting with '#' are comments and should come before the header.
# DREAM.3D StatsGenerator Angles Input File
# DREAM.3D Version 6.1.107.0d8bad9
# Angle Data is space delimited.
# Euler0 Euler1 Euler2 Weight Sigma
Angle Count:100
0 0 0 1 1
3.6 1.8 3.6 1 1
7.2 3.6 7.2 1 1
10.8 5.4 10.8 1 1
14.4 7.2 14.4 1 1
The only required header line is:
Angle Count:100
There are 5 columns of data which are the 3 Euler Angles, the Weight Value and the Sigma Value.
Delimiter
Choice of delimiter can be Comma (,), semicolon (;), space ( ), colon (:) or tab (\t)
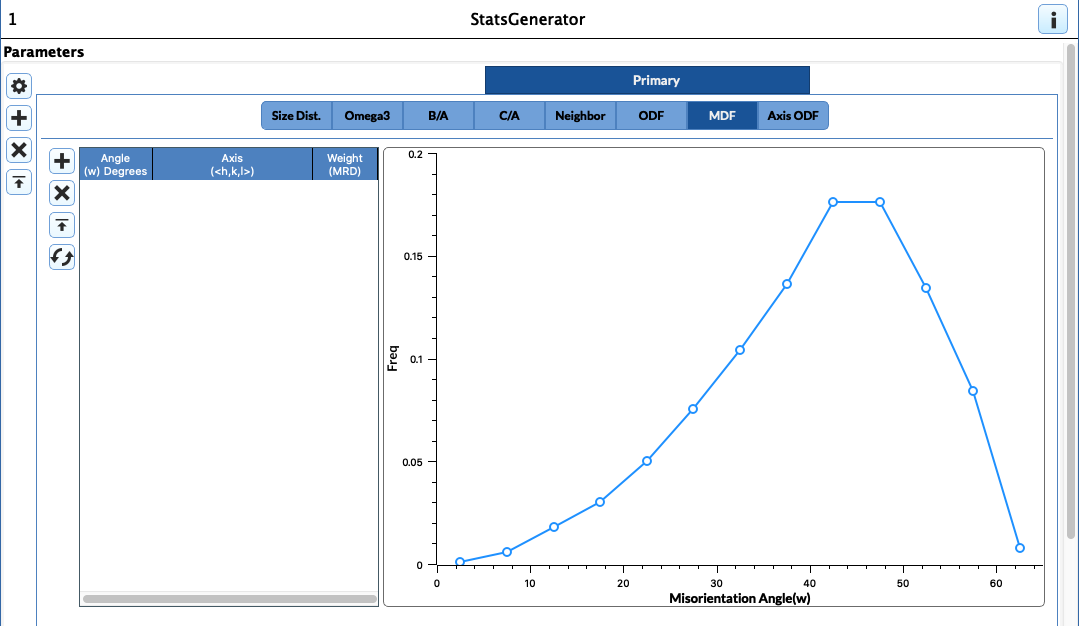
MDF Section
This sub-tab will display the baseline misorientation distribution function (MDF) for the generated ODF. The implemented algorithm proceeds by randomly sampling pairs of orientations from the ODF and calculating the misorientation (axis-angle only). Only the angle is plotted in the misorientation distribution plot. The user can also add axis-angle pairs to increase in weight.
 This will add a row to the table
 This will remove the currently selected row
 This will load the data from a file
 This will refresh the plot
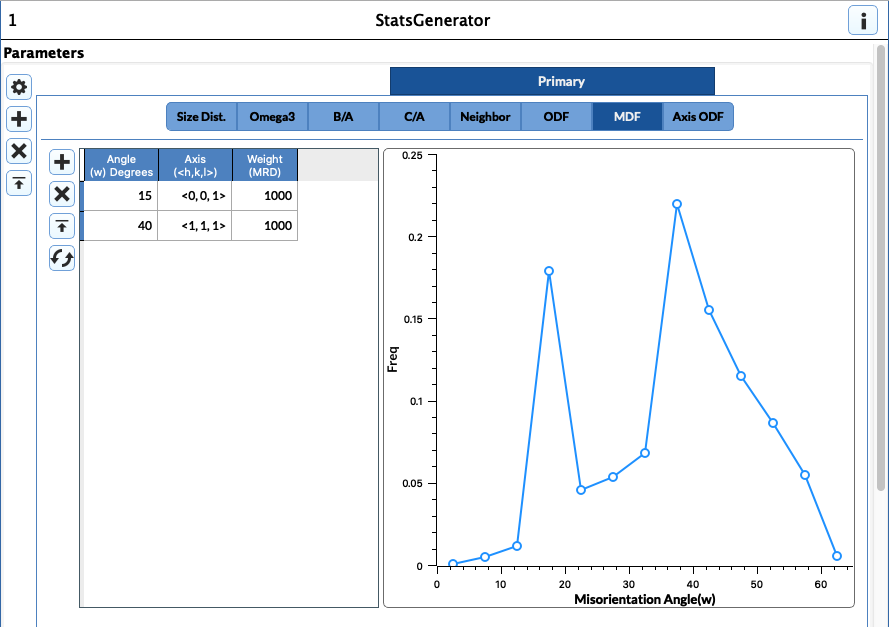
- Angle: The angle in Degrees of the misorientation to increase in weight
- Axis: The axis of the misorientation to increase in weight. If the crystal structure being used for the phase is Hexagonal, then this axis is in the 3-index, orthogonal convention, not the true (hkil) convention. For other Laue systems the user can use either the HKL integers or a normalized HKL vector.
- Weight: The weight in units of MRD (multiples of random distribution) for the entered misorientation
The option to load each row of data from a file is also allowed. The data in the input file must be of the following form:
    [NUMBER OF ENTRIES]
    [ANGLE] [AXIS H] [AXIS K] [AXIS L] [WEIGHT]
Note that the text file is not allowed to have any comment lines or extra lines.
Note that during the computation the Axis-Angle will be sanity checked to ensure that the angle is within the [0.0, Pi] range and the axis part is normalized.
All values will be interpreted as floating point values. An example file is shown next.
2
65 1.0234 10.234 0.23456 33000
20 0 1 0 5000
The following figure shows some example entries in the MDF Table:
Axis ODF Tab
This tab works in a similar fashion to the ODF tab in that the user can enter values that will orient the grains in a morhphological sense.
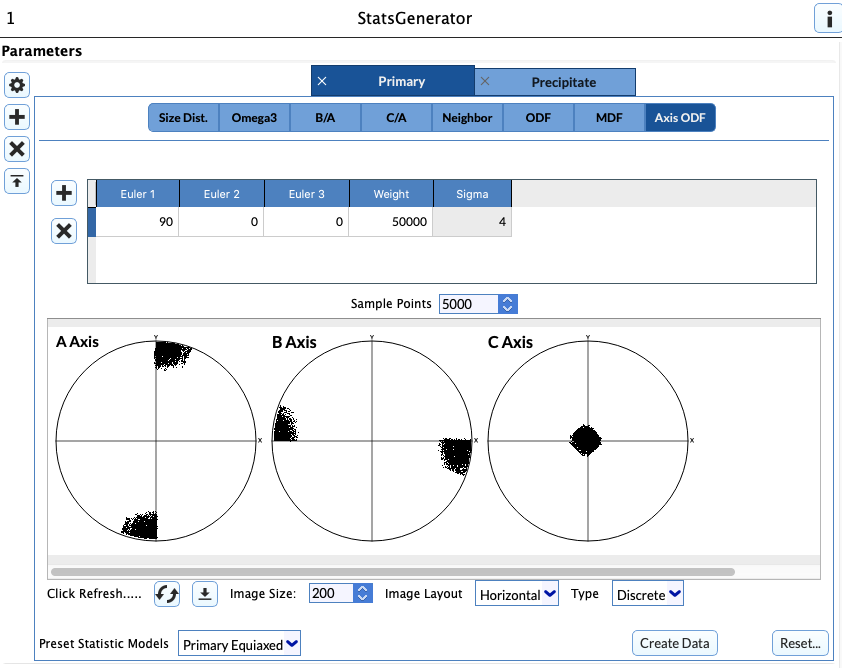
Weights and Spreads Section (Axis ODF)
- Euler 1-3: The Euler angles that define an orientation that the user would like to increase in weight given in Degrees and in the Bunge convention
- Weight: The weight in units of MRD (multiples of random distribution) for the entered orientation
- Sigma: Spread to use in blurring out the orientation chosen. The value corresponds to the number of bins in Rodrigues (orientation) space it takes for the MRD value entered in the Weight column to reduce to 0.0 (decreasing quadratically from the bin of the entered orientation)
-
Calculate ODF: Builds the ODF and then creates pole figures (PFs) for the user to inspect
-
Three polefigures are formed, which correspond to the location of the 3 principal axes of the grains to be generated (i.e., A > B > C)
Required Geometry
Not Applicable
Required Objects
None
Created Objects
| Kind | Default Name | Type | Component Dimensions | Description |
|---|---|---|---|---|
| Data Container | StatsGeneratorDataContainer | N/A | N/A | Created statistics Data Container name |
| Attribute Matrix | CellEnsembleData | CellEnsemble | N/A | Created Attribute Matrix name |
| Ensemble Attribute Array | Statistics | Statistics Object | (1) | Statistics objects (depending on phase type) that store fits to descriptors like: size distribution, shape distribution, neighbor distribution, ODF, MDF, etc) |
| Ensemble Attribute Array | CrystalStructures | uint32_t | (1) | Enumeration representing the crystal structure for each Ensemble |
| Ensemble Attribute Array | PhaseTypes | uint32_t | (1) | Enumeration specifying the phase type of each Ensemble |
Example Pipelines
- (02) Single Hexagonal Phase Equiaxed
- (03) Single Cubic Phase Rolled
- (05) Composite
- InsertTransformationPhase
- (01) Single Cubic Phase Equiaxed
- (04) Two Phase Cubic Hexagonal Particles Equiaxed
License & Copyright
Please see the description file distributed with this plugin.
DREAM3D Mailing Lists
If you need more help with a filter, please consider asking your question on the DREAM3D Users mailing list: