Find GBCD (Metric-Based Approach)
Group (Subgroup)
Statistics (Crystallographic)
Description
This Filter computes a section through the five-dimensional grain boundary distirbution for a fixed misorientation. An example of such a section is shown in Fig. 1. Differently than Find GBCD Filter, which uses a method based on partition of the boundary space into bins, this Filter implements an alternative metric-based approach described by K. Glowinski and A. Morawiec in Analysis of experimental grain boundary distributions based on boundary-space metrics, Metall. Mater. Trans. A 45, 3189-3194 (2014)
![Fig. 1: Section for the 17.9 deg./[111] misorientation through the grain boundary distribution obtained using this Filter for the small IN100 data set. Units are multiples of random distribution (MRDs).](../Images/FindGBCDMetricBased_dist.png)
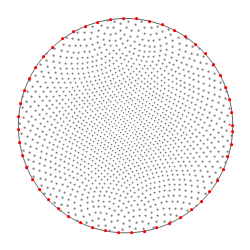
Metrics in the boundary space can be defined in a number of ways, but it is essential that two boundaries are close (distant) if they have similar (different) geometric features, and that symmetrically equivalent representations of boundaries are taken into consideration. Formally, the boundary space is a Cartesian product of the misorientation and boundary-normal subspaces. For computational reasons and because of considerably different resolutions in determinination of grain misorientation and boundary-plane parameters, it is convenient to use a separate metric in each subspace. With separate metrics, the procedure for computing distribution values for a selected misorientation has two stages. First, boundary segments with misorientations located not farther from the fixed misorientation than a limiting distance ρm are selected. In the second stage, the distribution is probed at evenly distributed normal directions (see Fig. 2), and areas of boundaries whose normals deviate from a given direction by less than ρp are summed. (The radii ρm and ρp should be tailored to resolution, amount, and quality of data and set.) Eventually, the obtained distribution is normalized in order to express it in the conventional units, i.e., multiples of the random distribution.
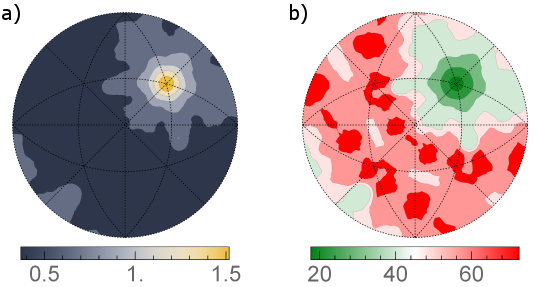
This Filter also calculates statistical errors of the distributions using the formula
ε = ( f n v )1/2
where ε is the relative error of the distribution function at a given point, f is the value of the function at that point, n stands for the number of grain boundaries (not the number of mesh triangles) in the considered network, and v denotes the volume restricted by ρm and ρp. The errors can be calculated either as their absolute values, i.e., ε × f (Fig. 3a) or as relative errors, i.e., 100% × ε (Fig. 3b). The latter are computed in a way that if the relative error exceeds 100%, it is rounded down to 100%.
Format of Output Files
Output files are formatted to be readable by GMT plotting program. The first line contains the fixed misorientation axis and angle. Each of the remaining lines contains three numbers. The first two columns are angles (in degrees) describing a given sampling direction; let us denote them col1 and col2, respectively. The third column is either the value of the GBCD (in MRD) for that direction or its error (in MRD or %, depending on user's selection). If you use other software, you can retrive spherical angles θ and φ of the sampling directions in the following way:
θ = 90° - col1
φ = col2
Then, the directions are given as [ sin θ × cos φ , sin θ × sin φ , cos θ ].
Parameters
| Name | Type | Description |
|---|---|---|
| Phase of Interest | int32_t | Index of the Ensemble for which to compute GBCD; boundaries having grains of this phase on both its sides will only be taken into account |
| Fixed Misorientation | float (4x) | Axis-angle representation of the misorientation of interest |
| Limiting Distances | float | ρm and ρp as defined above |
| Number of Sampling Points | int32_t | The approximate number of sampling directions |
| Exclude Triangles Directly Neighboring Triple Lines | bool | Only interiors of Faces are included in GBCD |
| Output Distribution File | File Path | The output file path (extension .dat, GMT format) |
| Output Distribution Errors File | File Path | The output file path (extension .dat, GMT format) |
| Save Relative Errors Instead of Their Absolute Values | bool | What type of errors to save (see above description for more detail) |
Required Geometry
Image + Triangle
Required Objects
| Kind | Default Name | Type | Component Dimensions | Description |
|---|---|---|---|---|
| Vertex Attribute Array | NodeTypes | int8_t | (1) | Specifies the type of node in the Geometry |
| Face Attribute Array | FaceLabels | int32_t | (2) | Specifies which Features are on either side of each Face |
| Face Attribute Array | FaceNormals | double | (3) | Specifies the normal of each Face |
| Face Attribute Array | FaceAreas | double | (1) | Specifies the area of each Face |
| Feature Attribute Array | FaceLabels | int32_t | (2) | Specifies which original Features are on either side of each boundary Feature |
| Feature Attribute Array | AvgEulerAngles | float | (3) | Three angles defining the orientation of the Feature in Bunge convention (Z-X-Z) |
| Feature Attribute Array | Phases | int32_t | (1) | Specifies to which phase each Feature belongs |
| Ensemble Attribute Array | CrystalStructures | uint32_t | (1) | Enumeration representing the crystal structure for each Ensemble |
Feedback
In the case of any questions, suggestions, bugs, etc., please feel free to email the author of this Filter at kglowinski at ymail.com
References
[1] K. Glowinski and A. Morawiec, Analysis of experimental grain boundary distributions based on boundary-space metrics, Metall. Mater. Trans. A 45, 3189-3194 (2014)
Example Pipelines
License & Copyright
Please see the description file distributed with this Plugin.